Metal Debugger#
Profiling is a key step for performance optimization. You can build MLX with
the MLX_METAL_DEBUG option to improve the Metal debugging and
optimization workflow. The MLX_METAL_DEBUG debug option:
Records source during Metal compilation, for later inspection while debugging.
Labels Metal objects such as command queues, improving capture readability.
To build with debugging enabled in Ruby prepend
CMAKE_ARGS="-DMLX_METAL_DEBUG=ON" to the build call.
The metal.start_capture() function initiates a capture of all MLX GPU
work.
Note
To capture a GPU trace you must run the application with
MTL_CAPTURE_ENABLED=1.
require "mlx"
mx = MLX::Core
a = mx.random_uniform([512, 512], 0.0, 1.0, mx.float32)
b = mx.random_uniform([512, 512], 0.0, 1.0, mx.float32)
mx.eval(a, b)

trace_file = "mlx_trace.gputrace"

# Make sure to run with MTL_CAPTURE_ENABLED=1 and
# that the path trace_file does not already exist.
if mx.metal_is_available
  begin
    mx.metal_start_capture(trace_file)
    10.times do
      mx.eval(mx.add(a, b))
    end
    mx.metal_stop_capture()
  rescue RuntimeError
    # Capture requires MTL_CAPTURE_ENABLED=1 and the Xcode capture layer.
  end
end
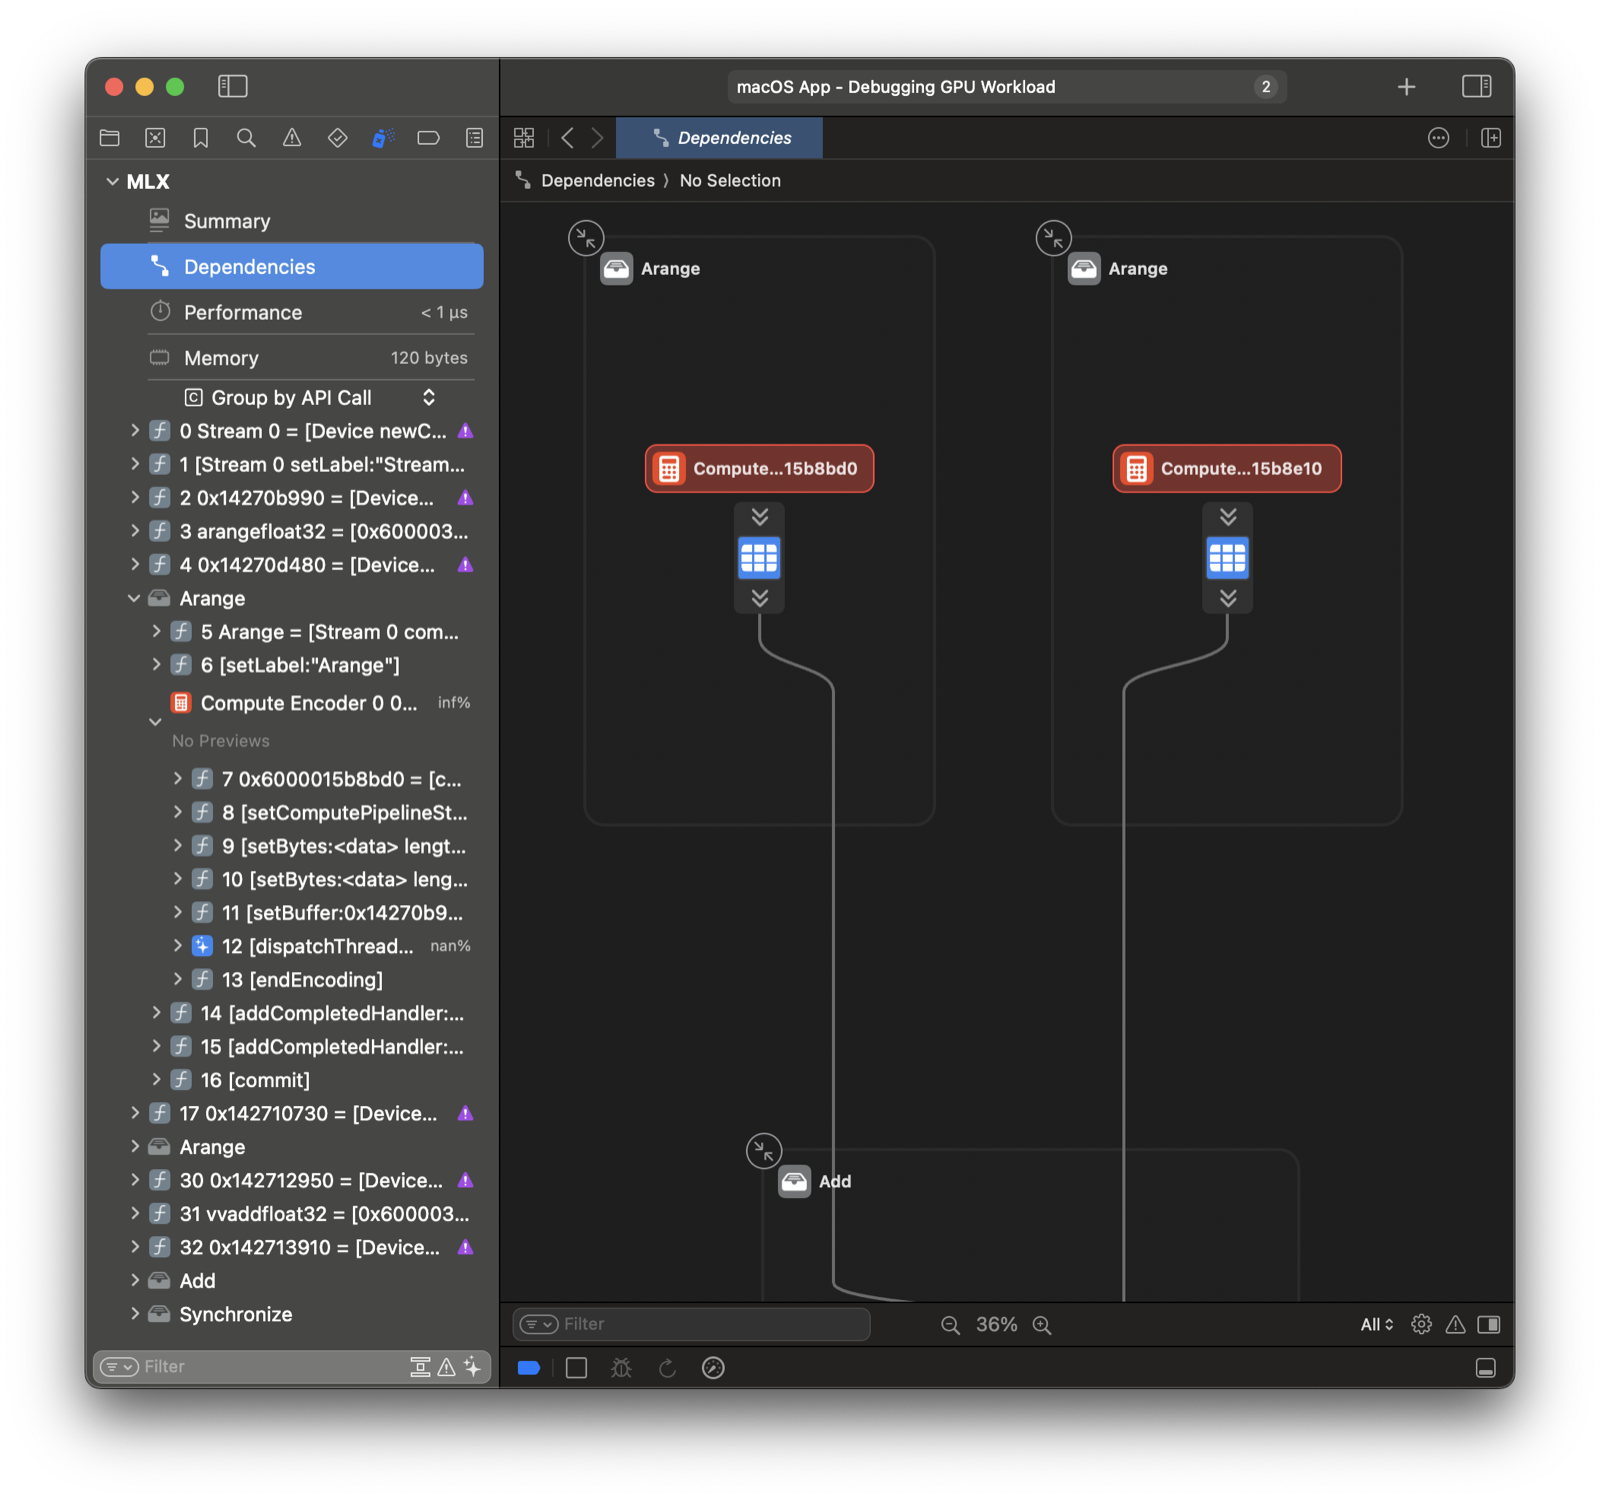
You can open and replay the GPU trace in Xcode. The Dependencies view
has a great overview of all operations. Checkout the Metal debugger
documentation for more information.
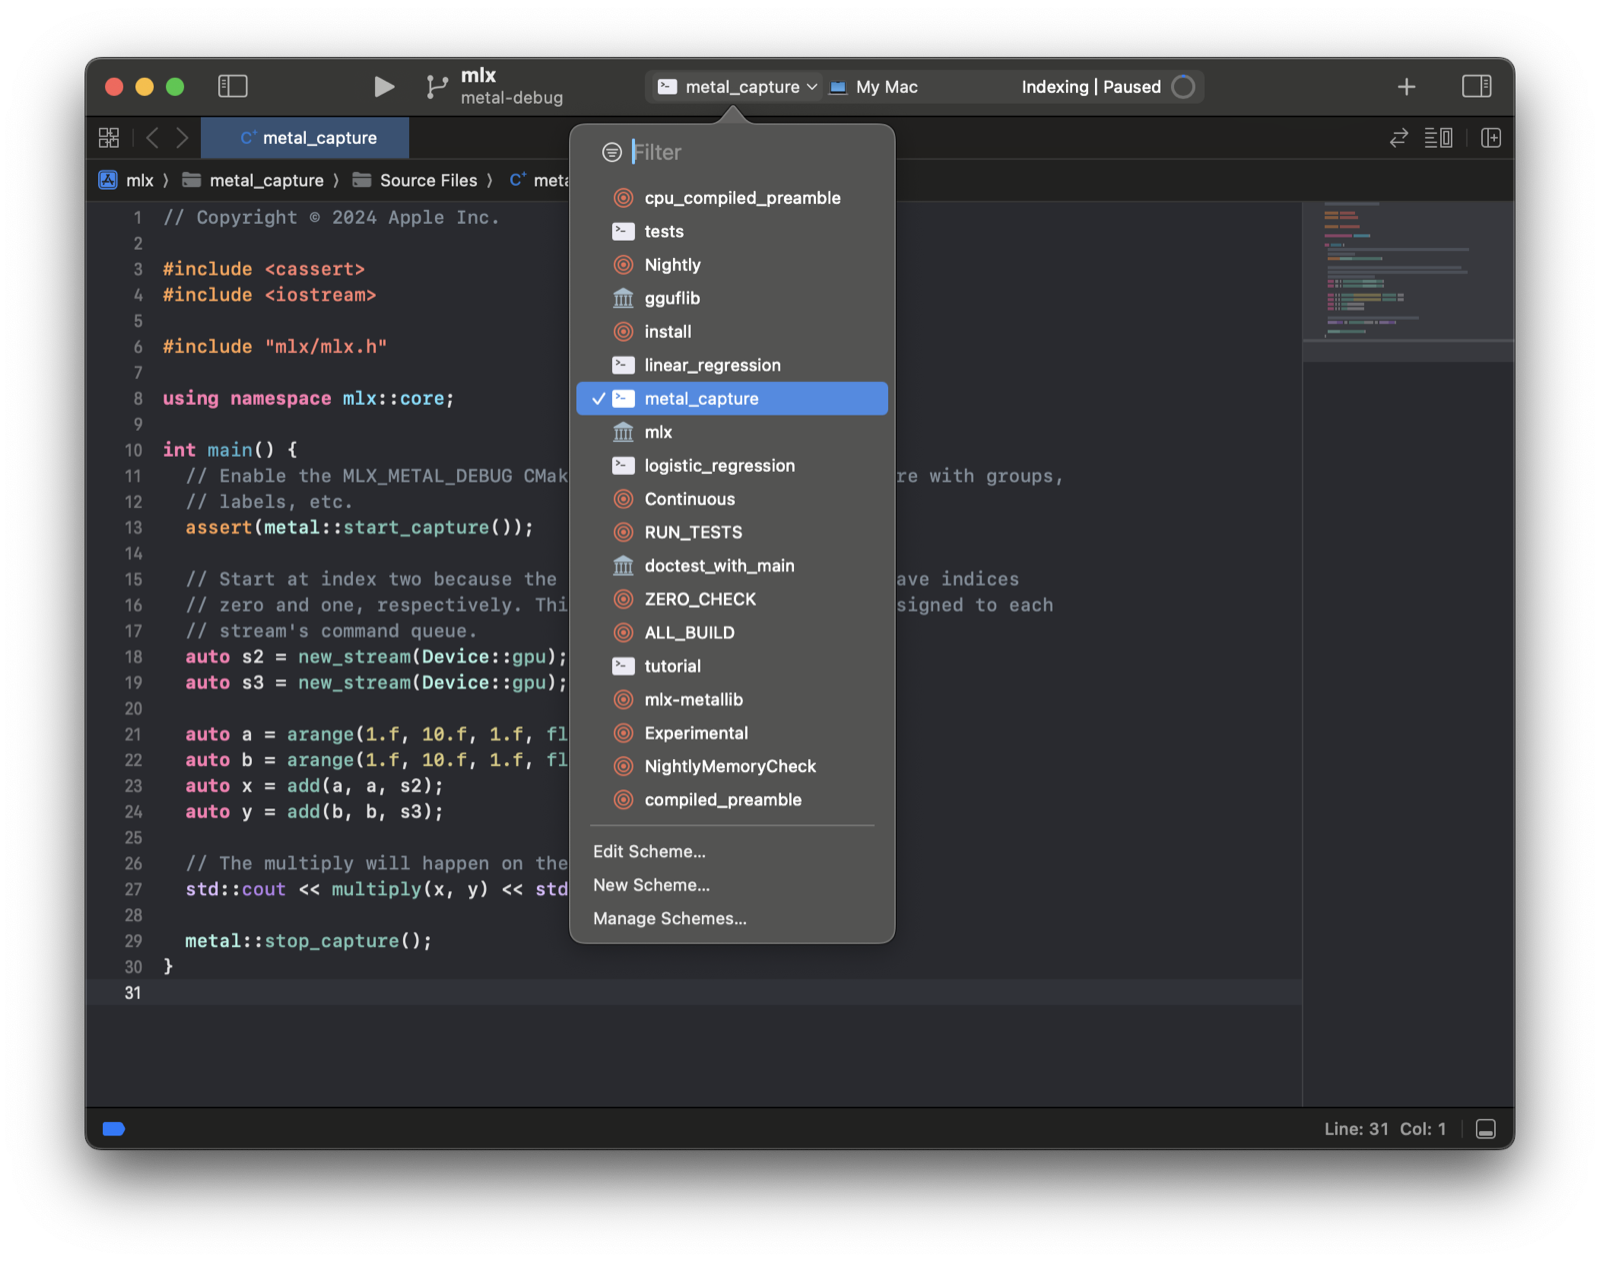
Xcode Workflow#
You can skip saving to a path by running within Xcode. First, generate an Xcode project using CMake.
mkdir build && cd build
cmake .. -DMLX_METAL_DEBUG=ON -G Xcode
open mlx.xcodeproj
Select the metal_capture example schema and run.